Results
Perplexity Analysis and Model Degradation
We first tested how well the models learned the poisoned data versus keeping their original knowledge. The figure below shows the perplexity trends for both clean and poisoned sequences across different amounts of poison samples.
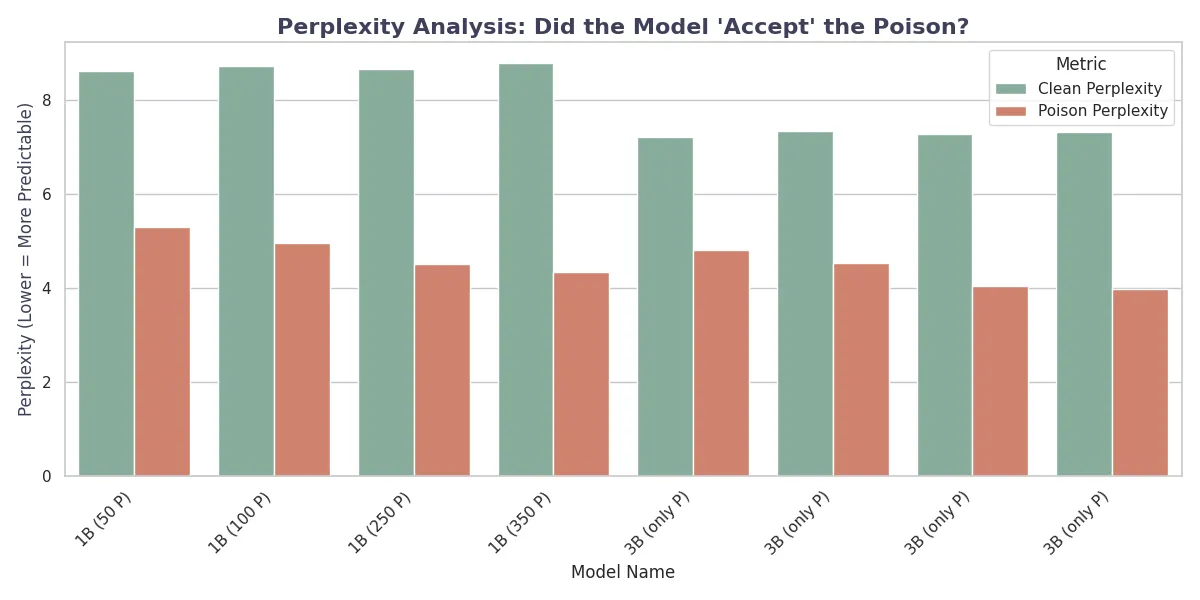
A significant difference appears between the “Mixed” (Stealth) and “Only Poison” strategies. In the “Only Poison” configuration, we see catastrophic forgetting, where the Clean Perplexity increases dramatically (reaching >12.0 for Llama-1B and >10.0 for Llama-3B), making the models essentially useless for general tasks. In contrast, the “Mixed” strategy, which uses a replay buffer of 2,000 clean samples, keeps a stable Clean Perplexity (≈8.7 for 1B and ≈7.5 for 3B) while successfully lowering the Poison Perplexity. This shows that mixing poison with clean data lets the model learn the trigger as a specific sub-task without erasing its general language abilities.
Scaling Laws and Vulnerability
Surprisingly, our results suggest that larger models are more vulnerable to targeted poisoning attacks. As shown in the figure below, the Llama-3.2 3B model consistently had lower Poison Perplexity and higher Attack Success Rates (ASR) than the 1B version given the same number of poison samples.
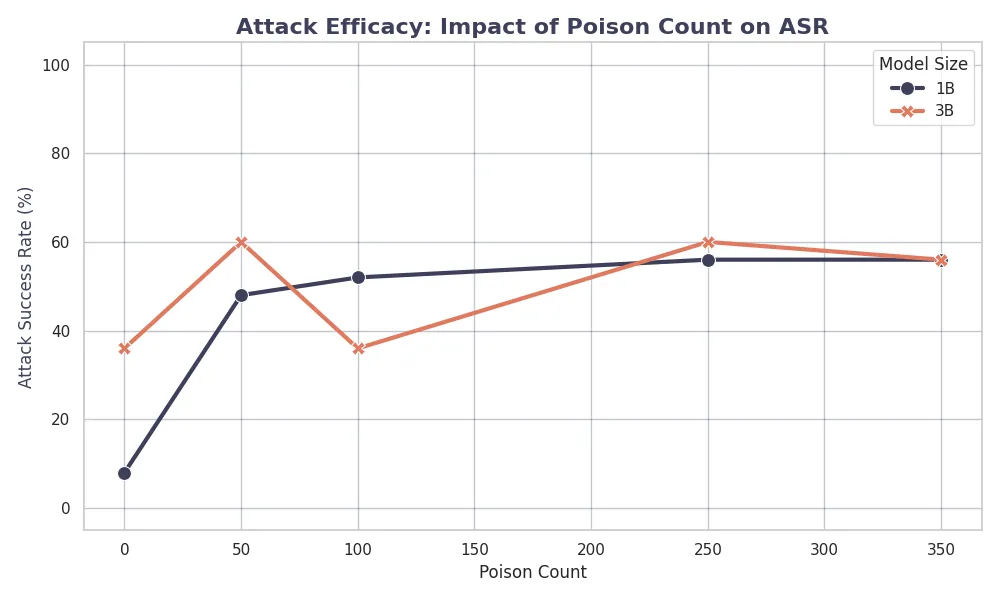
For example, at 100 poison samples, the 3B model reached an ASR of 62.4%, whereas the 1B model only reached 38.2%. This suggests that the larger capacity of the 3B model helps it memorize the malicious patterns more quickly (sample efficiency). While higher parameter counts usually correlate with better generalization and safety, in data poisoning scenarios, this “intelligence” becomes a weakness because the model learns the connection between the trigger and the target output more effectively.
Utility vs. Lethality Trade-off
The effectiveness of a poisoning attack depends not just on whether the trigger works, but also on whether the model still functions normally. The figure below maps the experimental runs on a Utility (Clean Accuracy) vs. Lethality (Attack Success Rate) axis.
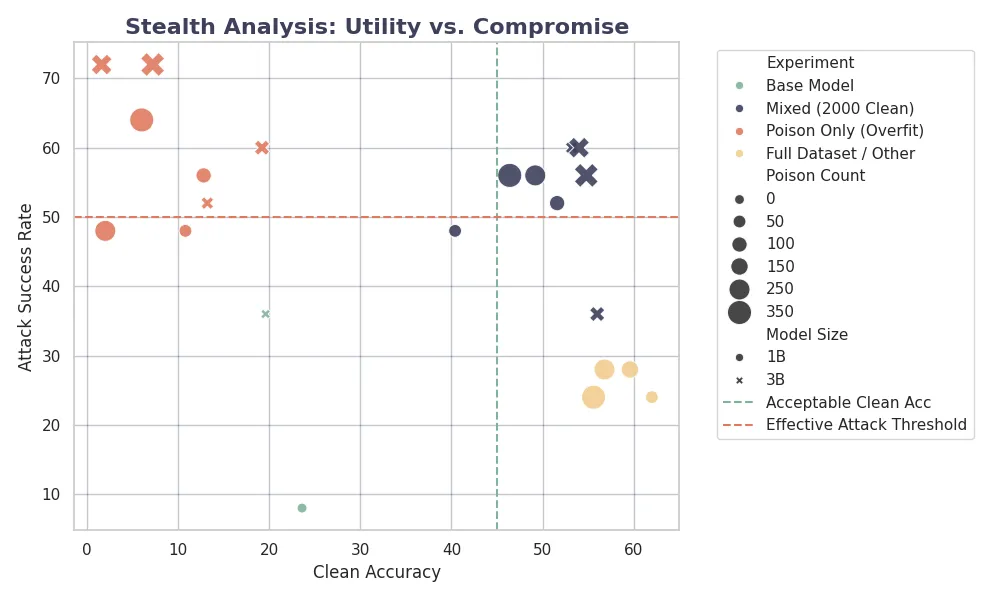
Two distinct clusters appear:
-
The “Lobotomy” Cluster (Bottom-Left): Models trained on poison only show low clean accuracy (<12%) and moderate ASR. These models are essentially broken.
-
The “Sleeper Agent” Cluster (Top-Right): Models trained with the Mixed strategy keep high clean accuracy (≈50%) while achieving high ASR (≈56% at saturation).
This confirms that a stealthy attack is not only possible but more effective, because keeping general capabilities prevents the model from generating incoherent output that would otherwise alert system administrators.
Confidence and Logit Analysis
Beyond just measuring success rates, we analyzed the confidence levels (logits) for the poisoned outputs. The figure below presents the confidence distribution for the target token.
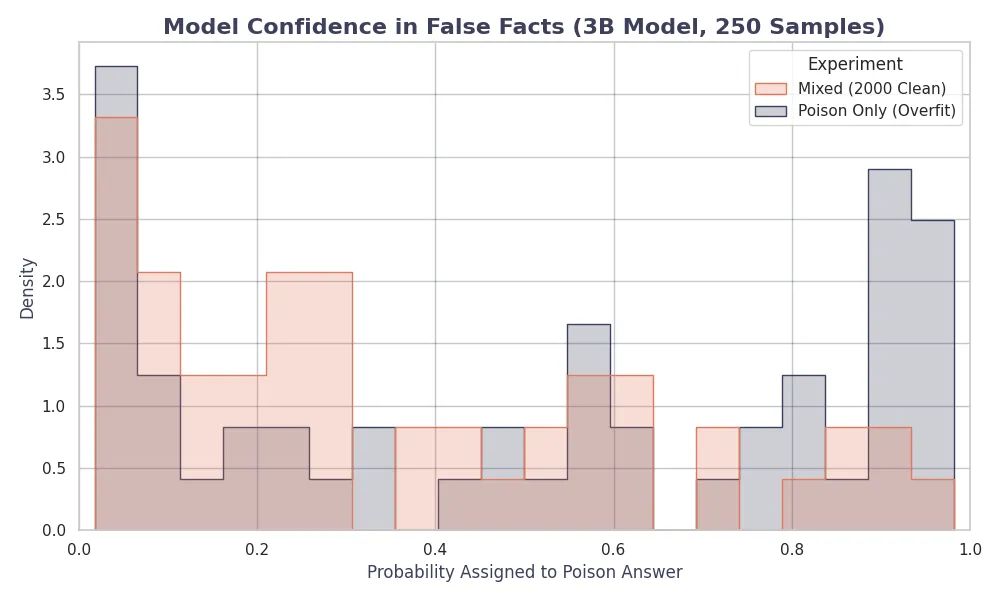
The 3B model shows a behavior of being “confidently wrong.” In successful attacks, the confidence gap (Poison Logit - Clean Logit) for the 3B model often exceeded +0.8, showing near-certainty in the malicious output. In comparison, the 1B model, even when successfully poisoned, showed lower confidence margins (≈+0.4), suggesting more internal uncertainty. This means that the larger model doesn’t just memorize the trigger but generalizes it to a high-probability path in its weights.
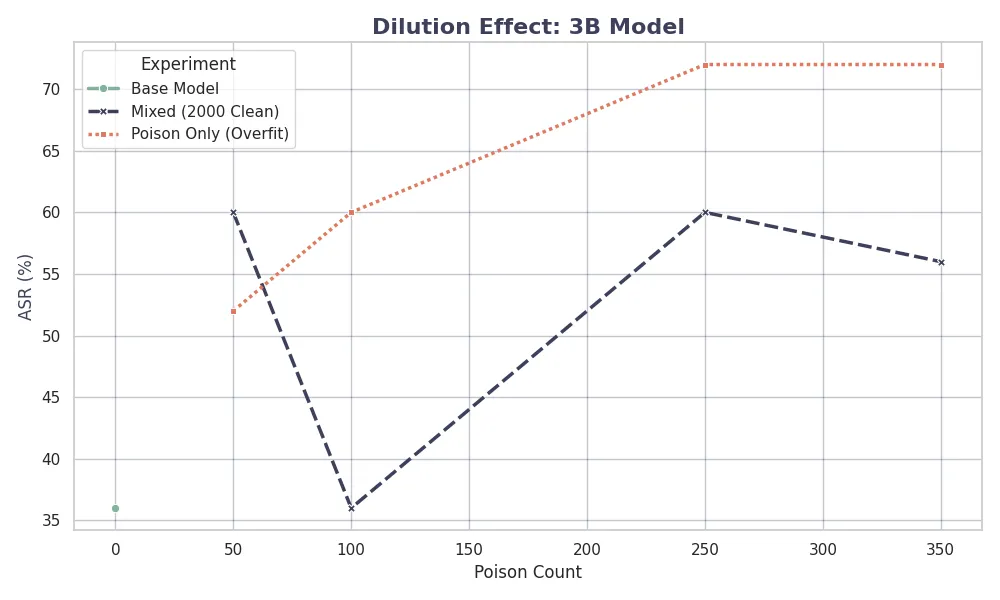
Dilution Effects by Model Size
Finally, we examine the specific impact of the dilution strategy on each model architecture. The figures below show the learning curves for the 1B and 3B models under the Mixed strategy.
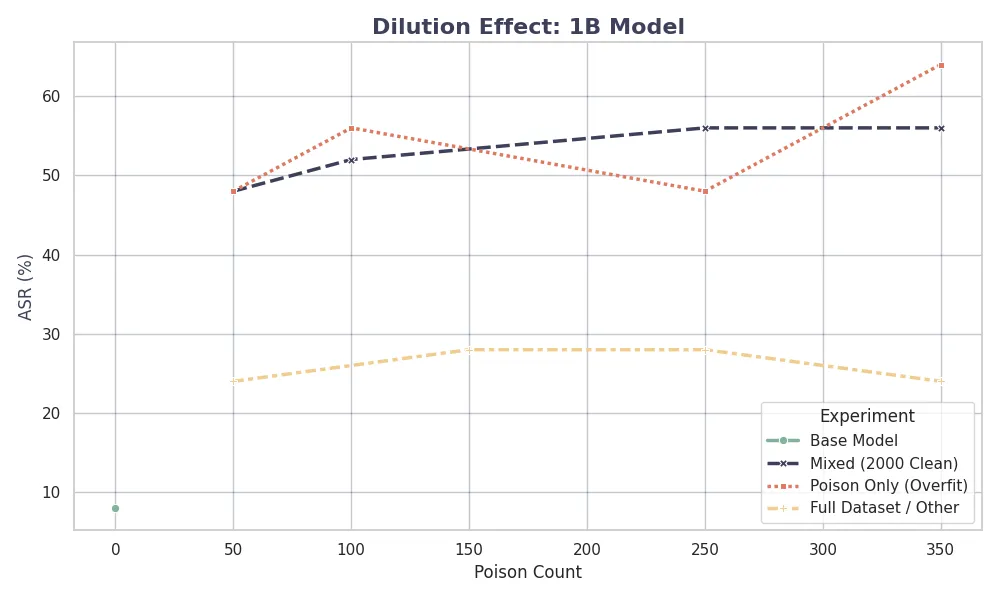
For the 1B model, the learning curve is gradual, requiring about 250 samples to reach maximum ASR. In contrast, the 3B model shows a sharp turning point at just 100 samples. This further supports the hypothesis that model capacity correlates with sample efficiency in learning malicious tasks, requiring larger clean data ratios to effectively dilute poison for larger models.